February, 2023 - Insights to Action
Trends look promising for produce demand entering 2023
- Inflationary pressures had a significant impact from mid-2021 through 2022.
- Q4 2022 showed trends stabilizing somewhat into the first part of 2023.
- Weather created some fluctuations the first four weeks in 2023 with +1.3% in sales and (4.1%) in volume
- Expect overarching trends to continue as the year progresses.

Regional Performance YTD (Four weeks)
- Incremental weather in Great Lakes and Northeast regions produced some unexpected softness in the first four weeks of 2023.
- Flooding also created issues. Data revealed parts of California are 200% over the historical average for rainfall to date—hurting the berries category.

Top 10 fruit and vegetables in USD (millions)
- The most popular fruits and vegetables make up nearly 20% of produce sold.
- Berry and apple volumes both struggled during the first four weeks of 2023, pulling the category below expectations.
- Berries (4.5%), apples (7.6%).

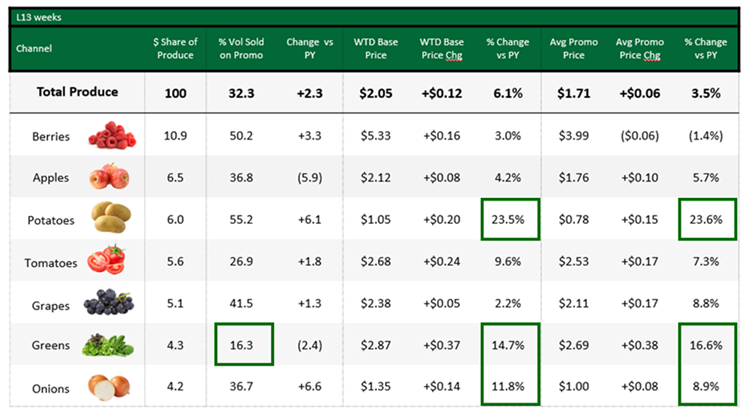
Base prices remain elevated
Promotional strategies adjust to the environment with increased frequency


- Over the last 13 weeks, base prices remain elevated and promoted prices are not as deep.
- Grocery chains have started to promote more often to combat the leakage of shoppers to “base price” leader retailers such as Wal-Mart.
- As consumers continue to eat at home, lower register ring items often used in meal prep have seen base prices rise significantly.
- A proper pricing strategy should include base price migration, increased promotional frequency, and a competitive promotional price versus market (not PY).
A price to pay1
- Inflation has softened as expected with total produce coming in at 5.6% versus 8.6% for the 2022 fiscal year.
- Fruits came in at 2.2%, while vegetables came in higher at 8.9%, due to softer laps from January 2022.
- As inflation eases, expect consumer to gravitate to base price leader channels.
- Shopper retention and engagement in traditional grocery can be improved with personalization and promotional activities.

Shopper concerns over prices continue to change behaviors2

A high-level look at shopper behaviors
|
97% worry about food cost inflation |
82% change one or more shopping habits |
53% seek sales to lower food costs |
43% dine our less due to inflation |
Dial-a-truck refrigerated load to truck ratio3
- The 2022 ratio metrics started elevated but continued to decline throughout the year, finishing significantly lower than 2021 ratios.
- Fuel rates were $4.54 per gallon in January 2023, which is 2.9% lower than December 2022, but still 23% higher than January 2022.4

Footnote
Calculation: Divide the number of load posts by the number of truck posts on DAT load boards, and that’s the load to truck ratio (LTR). When there are many loads posted, or few trucks are posted (or both) the LTR goes up. If the opposite occurs (few loads, many trucks), the ratio goes down.
Easter is the first major produce shopping holiday of the year
Sunday April 9, 2023
- Easter week is the largest produce sales lift of the spring, with many produce categories represented.
- Historically, Easter demand is equivalent to Thanksgiving and usually only trails peak summer events.
- Contact your local salesperson to assist in finalizing Easter activity.

Talking tropicals
- Over the last five years, tropicals has been the fastest growing category in produce, with a 6.4% average growth rate.
- While tropicals are available all year, seasonality and holiday events influence the demand curve by commodity.

Sources
- IRI Integrated Fresh, Total U.S., MULO, Calendar Year 2023 Ending 1.29.23.
- IRI Latest Shopper and Performance Topline Insights Across Food & Beverages.
- DAT Trucking Industry Trends: Reefer, Data Trendlines 2023.
- Ibid.
- IRI Integrated Fresh, Total U.S., MULO, Calendar Year 2023 Ending 1.29.23.